Search Oracle Related Sites

Thursday, April 14, 2011

AWR TOP 5 Timed Event Analysis - CPU Time

AWR Top 5 Timed Events - CPU Time

Most of the time we see CPU time in the TOP 5 list of AWR reports. So couple of questions we get to our mind is 1) Why the Wait Information is empty 2) How do we interpret the Time mentioned in the report.


1) Wait Information  is empty because “CPU time” is not wait event. It is the time spent on CPU to do the actual work.

2) Interpretation of CPU Time(s) 1033

We have 60*60=3600 CPU Seconds to use in a particular interval for single CPU in 1 hour snap


In the example we have 8 CPU (Num_CPUs under the Operating System Statistics of AWR) which relates to    60*60*8= 28800 CPU seconds to use in 1 hr interval. ( Single Database Machine is running on machine)

(1033/28800)*100 = 3.58% of Total CPU

So we are not CPU bound and things looks good from CPU point of View.

Other way to look at the CPU information is to drill down to the operating system statistics and look for Busy Time and Idle Time. If the Idle Time is high then there is not much contention for the CPU.




Thursday, March 31, 2011

AWR TOP 5 Timed Event Analysis - Cache Buffers Chains

TOP 5 Timed Event -Cache Buffers Chains

Problem: High CPU and delay in the transaction processing.

Definition: The cache buffers chains latches are used to protect a buffer list in the buffer cache. These latches are used when searching for, adding, or removing a buffer from the buffer cache. Contention on this latch usually means that there is a block that is greatly contended for (known as a hot block).

The reasons for this latch can be
1)Sequence number generation code that updates a row in a table to generate the number, rather than using a sequence number generator
2)Index leaf chasing from very many processes scanning the same unselective index with very similar predicate

How to identify the Identify the segment the hot block belongs to  -- Steps given below.. ( Metalink - How To Identify a Hot Block Within The Database Buffer Cache. [ID 163424.1]

To solve a hot block, the application maybe need to be reviewed.

By examining the waits on this latch, information about the segment and the
specific block can be obtained using the following queries.

First determine which latch id(ADDR) are interesting by examining the number of
sleeps for this latch. The higher the sleep count, the more interesting the
latch id(ADDR) is:
SQL> select CHILD#  "cCHILD"
     ,      ADDR    "sADDR"
     ,      GETS    "sGETS"
     ,      MISSES  "sMISSES"
     ,      SLEEPS  "sSLEEPS" 
     from v$latch_children 
     where name = 'cache buffers chains'
     order by 5, 1, 2, 3;

Run the above query a few times to to establish the id(ADDR) that has the most
consistent amount of sleeps. Once the id(ADDR) with the highest sleep count is found
then this latch address can be used to get more details about the blocks
currently in the buffer cache protected by this latch.
The query below should be run just after determining the ADDR with
the highest sleep count.
SQL> column segment_name format a35
     select /*+ RULE */
       e.owner ||'.'|| e.segment_name  segment_name,
       e.extent_id  extent#,
       x.dbablk - e.block_id + 1  block#,
       x.tch,
       l.child#
     from
       sys.v$latch_children  l,
       sys.x$bh  x,
       sys.dba_extents  e
     where
       x.hladdr  = '&ADDR' and
       e.file_id = x.file# and
       x.hladdr = l.addr and
       x.dbablk between e.block_id and e.block_id + e.blocks -1
     order by x.tch desc ;

Example of the output :SEGMENT_NAME                     EXTENT#      BLOCK#       TCH    CHILD#
-------------------------------- ------------ ------------ ------ ----------
SCOTT.EMP_PK                       5            474          17     7,668
SCOTT.EMP                          1            449           2     7,668

Depending on the TCH column (The number of times the block is hit by a SQL
statement), you can identify a hotblock. The higher the value of the TCH column,
the more frequent the block is accessed by SQL statements.

In order to reduce contention for this object the following mechanisms can be put in place:
1) Examine the application to see if the execution of certain DML and SELECT statements
    can be reorganized to eliminate contention on the object.

2) Decrease the buffer cache -although this may only help in a small amount of cases.

3) DBWR throughput may have a factor in this as well.
    If using multiple DBWR's then increase the number of DBWR's.

4) Increase the PCTFREE for the table storage parameters via ALTER TABLE
    or rebuild. This will result in less rows per block.

5) Consider implementing reverse key indexes
   (if range scans aren't commonly used against the segment)

6)  In the AWR you can look for segments with high buffer waits and sql statements whose elapsed times are high on a particular objects. If you are having high transaction OLTP databases it is always better if we can have the lesser block size to avoid the contention like 4k block size.

Monday, March 14, 2011

AWR TOP 5 Timed Event Analysis - Latch Free


Top 5 Times Events

latch free , latch: library cache , latch: library cache lock

latch free – System is waiting for a latch to become free


Basically it means some session needed a latch (on the library cache for example to parse some SQL). it tried to get the latch, but failed (because someone else had it). So, it goes to sleep (waits on a latch free) and wakes up and tries again. The time it was asleep - that is the wait time for "latch free"

A latch is a low-level internal lock used by Oracle to protect memory structures. The latch free event is updated when a server process attempts to get a latch, and the latch is unavailable on the first attempt.

There is a dedicated latch-related wait event for the more popular latches that often generate significant contention. For those events, the name of the latch appears in the name of the wait event, such as latch: library cache or latch: cache buffers chains. This enables you to quickly figure out if a particular type of latch is responsible for most of the latch-related contention. Waits for all other latches are grouped in the generic latch free wait event.

Actions

This event should only be a concern if latch waits are a significant portion of the wait time on the system as a whole, or for individual users experiencing problems.

• Examine the resource usage for related resources. For example, if the library cache latch is heavily contended for, then examine the hard and soft parse rates.

• Examine the SQL statements for the sessions experiencing latch contention to see if there is any commonality.

Once you see this event as TOP, you need to further drill down the AWR report to Latch Statistics section to see Latch Activity and Latch Sleep Breakdown to determine which latch is doing more no of misses, sleeps and spin gets. Based on which one has to look for data what is causing these.

If you see library cache latch, then possible causes might be lack of statement reuse, statements not using bind variables, cursors closed explicitly after each execution.

If one see cache buffers chains as top event with more misses and sleeps then the possible cause might be repeated access to a block known as hot block which is caused due to Sequence number generation code that updates a row in a table to generate the number, rather than using a sequence number generator.

We have found that in our case a poorly written package was hitting us hard where huge hard parses were found. There are lot many queries to find out the queries which are performing the hard parses like

SELECT SQL_TEXT FROM V$SQLSTATS WHERE EXECUTIONS < 4 ORDER BY SQL_TEXT;

SELECT SUBSTR(SQL_TEXT, 1, 60), COUNT(*) FROM V$SQLSTATS WHERE EXECUTIONS < 4 GROUP BY SUBSTR(SQL_TEXT, 1, 60)HAVING COUNT(*) > 1;

Check the V$SQLSTATS view. Enter the following query:

SELECT SQL_TEXT, PARSE_CALLS, EXECUTIONS FROM V$SQLSTATS ORDER BY PARSE_CALLS;

When the PARSE_CALLS value is close to the EXECUTIONS value for a given statement, you might be continually reparsing that statement. Tune the statements with the higher numbers of parse calls.

Tuesday, March 1, 2011

AWR TOP 5 Timed Event Analysis


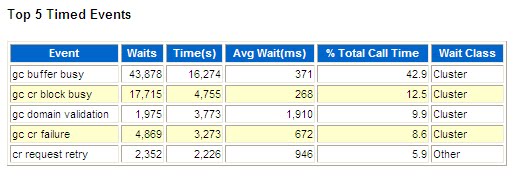
gc buffer busy


The gc current block busy and gc cr block busy wait events indicate that the local instance that is making the request did not immediately receive a current or consistent read block. The term "busy" in these events' names indicates that the sending of the block was delayed on a remote instance. For example, a block cannot be shipped immediately if Oracle Database has not yet written the redo for the block's changes to a log file.

In comparison to "block busy" wait events, a gc buffer busy event indicates that Oracle Database cannot immediately grant access to data that is stored in the local buffer cache. This is because a global operation on the buffer is pending and the operation has not yet completed. In other words, the buffer is busy and all other processes that are attempting to access the local buffer must wait to complete.
The existence of gc buffer busy events also means that there is block contention that is resulting in multiple requests for access to the local block. Oracle Database must queue these requests.

Usually, either interconnect or load issues or SQL execution against a large shared working set can be found to be the root cause.

gc buffer busy‟ waits can happen for many reasons. Few of them are: CPU starvation issues, Swapping issues, interconnect issues etc. For example, if the process that opened the request for a block did not get enough CPU, then it might not drain the network buffers to copy the buffer to buffer cache. Other sessions accessing that buffer will wait on „gc buffer busy‟ waits. Or If there is a network issue and the Global cache messages are slower, then it might induce higher gc buffer busy waits too. Statistics „gc lost packets‟ is a good indicator for network issues, but not necessarily a complete indicator.

Solution

If this wait event was found on the top 5 wait events then one has to immediately look for "Segments by Global Cache Buffer Busy" section of the AWR to check buffers of which objects are contributing to the wait event. Then look for Sql Statements which are being fired from multiple instances and see if one can reduce the contention either by ensuring that applications which perform transactions on these objects very frequently should be pointed to a single node or look for other issues like cache values of sequences on these objects or CPU , network, interconnect , large loads etc.

Tuesday, February 22, 2011

AWR TOP 5 Timed Event Analysis


enq: TX - row lock contention
Enqueues are locks that coordinate access to database resources. This event indicates that the session is waiting for a lock that is held by another session.

The name of the enqueue is included as part of the wait event name, in the form enq: enqueue_type - related_details. In some cases, the same enqueue type can be held for different purposes, such as the following related TX types:
enq: TX - allocate ITL entry
enq: TX - contention
enq: TX - index contention
enq: TX - row lock contention

These are acquired exclusive when a transaction initiates its first change and held until the transaction does a COMMIT or ROLLBACK.

• Waits for TX in mode 6: occurs when a session is waiting for a row level lock that is already held by another session. This occurs when one user is updating or deleting a row, which another session wishes to update or delete. This type of TX enqueue wait corresponds to the wait event enq: TX - row lock contention.

•Waits for TX in mode 4 can also occur if a session is waiting due to potential duplicates in UNIQUE index. If two sessions try to insert the same key value the second session has to wait to see if an ORA-0001 should be raised or not. This type of TX enqueue wait corresponds to the wait event enq: TX - row lock contention.


Problem: The performance of overall database will be effected with this kind of Wait Event and DB Time in AWR will be very high.


Solution:The solution is to have the first session already holding the lock perform a COMMIT or ROLLBACK. In our situation we have seen extensive usage of select for update statements. Reducing these we have reduced a lot of wait events. Also we have found couple of procedures where commit is being kept at the end rather immediately after the update statement. After placing the commits closure to the update statement the wait event has drastically reduced.

Friday, February 18, 2011

AWR Timed Event Analysis

Top 5 Timed Event --- direct path read


direct path read and direct path read temp
When a session is reading buffers from disk directly into the PGA (opposed to the buffer cache in SGA), it waits on this event. If the I/O subsystem does not support asynchronous I/Os, then each wait corresponds to a physical read request.
If the I/O subsystem supports asynchronous I/O, then the process is able to overlap issuing read requests with processing the blocks already existing in the PGA. When the process attempts to access a block in the PGA that has not yet been read from disk, it then issues a wait call and updates the statistics for this event. Hence, the number of waits is not necessarily the same as the number of read requests (unlike db file scattered read and db file sequential read).

Causes

This happens in the following situations:
•The sorts are too large to fit in memory and some of the sort data is written out directly to disk. This data is later read back in, using direct reads.

•Parallel slaves are used for scanning data.

•The server process is processing buffers faster than the I/O system can return the buffers. This can indicate an overloaded I/O system.

Actions
This wait event can be because of large sorts to disk or full table scans by parallel slaves. This is the biggest wait for large data warehouse sites. However, if the workload is not a DSS workload, then examine why this is happening.
In the above scenario we identified a query using parallel slaves performing multiple full scans on couple of tables having 20 million records each. If tables are defined with a high degree of parallelism, then this could skew the optimizer to use full table scans with parallel slaves and result into direct path read wait event on the top.

Wednesday, February 16, 2011

AWR / TOP 5 Timed Event

Top 5 Timed Event ---SGA: allocation forcing component growth

Problem: Database Hangs/ Some of the jobs like export fails.


Solution : The waits for "SGA: allocation forcing component growth" indicates that SGA is inadequate. It looks like there is no enough memory available in SGA for the growth of components. SGA has to be increased or disable the SGA automation by setting SGA_TARGET=0. I will write more about the problems of SGA Resizing as there are many bugs related to the functionility.One has to query the view V$Sga_Resize_Ops to know how many times Oracle Resizes are happening.

Wednesday, March 3, 2010

Oracle 10g Top 5 Timed Events - backup timed events


In the TOP 5 Times Events, i have highlighted couple of events related to backup job. IMM OP wait event falls under the other category but related to the RMAN backup. The other one you see is Backup : sbtbackup falls under the administrative category also realted to the RMAN. These wait events will occur when there is RMAN backup running on the server.

imm op

Meaning: Waiting for an IMMEDIATE I/O request to a slave process to end.The event "imm op" may occur if I/O slaves are used,

that is, if parameters such as DBWR_IO_SLAVES or BACKUP_TAPE_IO_SLAVES are used.

BACKUP_TAPE_IO_SLAVES is set to TRUE in the case of a RMAN backup if dedicated I/O slave processes are to copy backup write

processes to tape and not the Oracle shadow processes. In this case, "imm op" waits only affect the backup runtime, but not the live system.

Backup: sbtbackup

Meaning: Wait situations during RMAN backup. The wait events that begin with "Backup: sbt" are associated with wait situations during a RMAN backup. This means they only affect the backup runtime.

One has to be careful with these events especially during the peak time, they should not be in the TOP 5. If they are found in the peak time, one has to look at scheduling the backup during the non peak time and also these will occur when RMAN is backing up the database directly to the TAPE instead to a disk. As backup is a heavy DISK and CPU intensive job, it has to be done during the non peak time only.

Thursday, February 18, 2010

AWR Analysis - Oracle "Wait Class" from 10g


Top 5 Timed Events and Wait Class Categories from 10g

Oracle 10g includes many enhancements to the wait event interfaces. Among them the introduction of wait classes has made the life of the DBA a lot easier in identifying the problem. The color coding given to these wait classes helps the DBA's to identify and correlate the problem to a particular category. And also the same wait class concept has been used in AWR reports as well as in many screens of the enterprise manager for example in monitoring the TOP Activity under Performance TAB Of Enterprise Manager.

In Oracle 10g wait events are classified into categories which can help the DBA to more easily determine the likely cause of the problem. The categories are:
Administrative, Idle, Application , Network , Cluster Scheduler , Commit , System I/O , Concurrency , User I/O , Configuration , Other

DBA can identify from a distance by looking at the color of the activity in the enterprise manager.

The first diagram is the TOP Activity of Enterprise Manager showing the activity in colors and right side you can see the color coding against each category.The second diagram shows the AWR report TOP 5 Times Events and Wait Class Statistics.

Happy tuning.

Thursday, June 11, 2009

AWR / Statspack Analysis


Problem : Performance and High CPU

Solution / Interpretation : The TOP Event log file sync This wait event is seen in most of the high transactional databases where more frequent commits happens. Let us look deep into the concept and then see how we can reduce that, definitely we cannot avoid it.

At commit time, process creates a redo record [ containing commit op codes] and copies that redo record in to log buffer. Then that process signals LGWR to write contents of log buffer. LGWR writes from log buffer to log file and signals user process back completing a commit. Commit is considered successful after LGWR write is successful.

Commit is not complete until LGWR writes log buffers including commit redo recodes to log files. In a nutshell, after posting LGWR to write, user or background processes waits for LGWR to signal back with 1 sec timeout. User process charges this wait time as ‘log file sync’ event.


LGWR is unable to complete writes fast enough for one of the below reasons..

1)Disk I/O performance to log files is not good enough.

2)LGWR is starving for CPU resource. If the server is very busy, then LGWR can starve for CPU too. This will lead to slower response from LGWR, increasing ‘log file sync’ waits.

3)LGWR is unable to complete writes fast enough due to file system or unix buffer cache limitations.

4)LGWR is unable to post the processes fast enough, due to excessive commits. It is quite possible that there is no starvation for cpu or memory and I/O performance is decent enough. Still, if there are excessive commits, then LGWR has to perform many writes/semctl calls and this can increase ‘log file sync’ waits. This can also result in sharp increase in redo wastage’ statistics’.

This event is also the major contributor for overall CPU usage.

In the above scenario, we cannot avoid the COMMITS as the application requires it. What i have done is reduced the CPU contention so that LGWR does not wait for the lack of CPU.

The other aspect is to see where these online redo log files are created. We have made raw devices for these files so that the writing happened fast.

Also there is a misconception that increasing the redo log buffer will solve the problem , but this is not the case as if you the see fundamentals of log buffer flush is for every commit or when 1/3 is full or 1 MB of redo is generated. In this case for every commit there is redo buffer flush happenes so no need to have the redo buffer more than 3MB.

Also try to place the major hot tables and indexes separately on to multiple disks to increase the disk i/o.

Team ORAKHOJ
Get free AWR / Statspack Analysis by sending mail to tuning@orakhoj.com