Search Oracle Related Sites

Tuesday, September 20, 2011

Top 5 Timed Events - RAC GC Wait Events

gc current grant 2 –way

In a 2 Node or 3 Node RAC environment when a instance needs a block in current mode, it sends the request to the master instance. The master instance finds that currently no instances, including self , has any lock on the requested block. It sends a message back to the requesting instance granting it the shared lock on the block. The requesting instance then reads the block from the disk. This event does not indicate any contention. The presence of this event in the Top 5 list indicated that the instance is spending a significant amount of time in obtaining the locks.

·         Tune the SQL to optimize the number of blocks accessed by the application, thereby reducing the no of blocks it is requesting.


gc current block 2 –way

An instance requests authorization for a block to be accessed in the current mode to modify the block. The instance mastering the corresponding resource received the request.  The master has the current version of the block and sends the current copy of the block to the requestor via the Cache Fusion mechanism. This event indicates write/write contention. The appearance of gc current block 2 way in the Top 5 event section does not necessarily indicate performance issues. It merely indicated that the instances are accessing copies of data present in each other’s cache  and that the cache fusion mechanism is being used to transfer copies of the data among the instances. However if the average wait time for each event is very high, it might be impacting performance and needs further analysis.

·         Analyze the contention. Segments in the Current Blocks Received section of the AWR report should help to identify the top contentious objects.

·         Ensure the good database object design practices, database object layout, and space management practices are being followed for the top contentious objects.
In the next blog i will come out with a clear cut definitions and various types of RAC Wait Events.

Thursday, August 25, 2011

Top 5 Timed Foreground Events - cursor: pin S wait on X

Top 5 Timed Foreground Events - cursor: pin S wait on X

Cursor: pin S wait on X.
A session waits on this event when requesting a mutex for shareable operations related to pins (such as executing a cursor), but the mutex cannot be granted because it is being held exclusively by another session (which is most likely parsing the cursor). 


This wait event will occur in mulitple scenarios, In 10g we have observes this is due to the frequent Automatic Memory Management Resize operations. Setting the SGA_TARGET to zero solved the problem. There are many bugs in versions of 10g versions. (The bug is tracked as Bug 6528336 – LARGE NUMBER OF SESSIONS WAITING ON CURSOR: PIN S WAIT ON X)

This has been fixed in further releases of 10g and 11g.

We received the above error while performing the load test in our environment in 11g R2 and the below query has helped us in identifing sql responsible for this.

In 11g R2, the blocking session can be found directly using the following sql:
SQL> select sid,serial#,SQL_ID,BLOCKING_SESSION,BLOCKING_SESSION_STATUS,EVENT
from v$session where event ='cursor: pin S wait on X'

SID SERIAL# SQL_ID BLOCKING_SESSION BLOCKING_SESSION_STATUS EVENT
---- ------- ------------- ---------------- ----------------------- ----------
125 8190 3d3pd7g7dwuf6 135 VALID cursor: pin S wait on X

One of the most likely causes of cursor: pin S wait on X is high parsing time. Therefore the reason for the high parse time should be investigated.

11g R1 Below Diagonosis


As a result of Bug 7568642 BLOCKING_SESSION EMPTY FOR "CURSOR: PIN S WAIT ON X" the blocking_session is not populated in 10.2.The bug is fixed in 11g R1. Below approach can be used to idetify the necessary sql causing this wait.
The column P2RAW in v$session or v$session_wait gives the blocking session for wait event cursor: pin S wait on X.
The top bytes of p2raw is the blocker. It is in hex so needs to be converted in decimal.
SQL> select p2raw from v$session where event = 'cursor: pin S wait on X';

P2RAW
----------------
0000001F00000000
The top bytes of p2raw is the blocker.
Taking 0000001F (the first 8 bytes) and converting to decimal gives session id 31.
Or simply:
SQL> select p2raw,to_number(substr(to_char(rawtohex(p2raw)),1,8),'XXXXXXXX') sid
from v$session
where event = 'cursor: pin S wait on X';

P2RAW SID
---------------- ---
0000001F00000000 31
SQL> select p1, p2raw, count(*) from v$session
where event ='cursor: pin S wait on X'
and wait_time = 0
group by p1, p2raw;
p1 = the mutex Id
This has the same definition as v$mutex_sleep_history.mutex_identifier
    p2raw = holding Session Id | Ref Count The most significant bytes always store the Holding Session Id (Holding SId). The least significant bytes always store the Ref Count.
The blocking session can be queried to see what it is doing and if anyone is blocking it.
SQL> select sid,serial#,SQL_ID,BLOCKING_SESSION,BLOCKING_SESSION_STATUS,EVENT
from v$session where SID=31

Tuesday, August 9, 2011

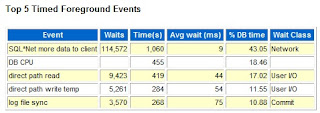
AWR Top 5 Timed Event - SQL*Net more data to client

SQL*Net more data to client -The server process is sending more data/messages to the client


The SQL*Net more data to client Oracle metric indicates the server process is sending more data/messages to the client. The previous operation to the client was also a send.

The first session data unit (SDU) buffer of return data is written to TCP socket buffer under “SQL*Net message to client” wait event. If Oracle needs to write more data for a call than fits into the “first” SDU buffer, then further writes for that call are done under SQL*Net more data to client event.

One can check with the Network Team on the overall network performance between Application Server and Database Server and also try to increase the SDU parameter at Listener and Tnsnames Levels. In our case after increasing the SDU parameter we have seen significant reduction in the wait event.


SID_LIST_LISTENER =

  (SID_LIST =

    (SID_DESC =

      (SDU=32640)

      (SID_NAME = ORAKHOJ)

      (ORACLE_HOME = /export/home/oracle10)

    ))

Tnsnames.ora

ORAKHOJ = (DESCRIPTION =

    (SDU=32640)

    (ADDRESS = (PROTOCOL = TCP)(HOST = ORAKHOJServer)(PORT = 1521))

    (CONNECT_DATA =

      (SERVER = DEDICATED) (SERVICE_NAME = ORAKHOJ)

    ) )


Network bottlenecks are very common in distributed systems and those with high network traffic. They are manifested as SQL*Net wait events, below are more wait events discussed below.

SQL*Net more data from client

Def: The server is waiting on the client to send more data to its client shadow process, in an already initiated operation

Solution: Usually OK, reduce data transferred, possible Network problems.

SQL*Net more data to client

Def: The server process is sending more data/messages to the client. The previous operation to the client was also a send.

Wait Time: The actual time it took for the send to complete

Solution: Usually OK, reduce amount of data transferred, possible Network tuning needed ( SDU)

SQL*Net break/reset to client

Def: The server sends a break or reset message to the client. The session running on the server waits for a reply from the client.

Wait Time: The actual time it takes for the break or reset message to return from the client


Solution: Check for errors in sql statement


SQL*Net more data from dblink

Def :The foreground process is expecting more data from a data base link.

Wait Time: The total time it takes to read the data from the database link (including the waiting time for the data to arrive)

Solution: Reduce data transfer, check net response

SQL*Net break/reset to dblink

Def: The server sends a break or reset message to the client. The session running on the server waits for a reply from the client.

Wait Time: The actual time it takes for the break or reset message to return from the client

Solution: Check for errors in sql statement sent


Monday, August 1, 2011

DB Time & AWR TOP 5 Timed Events

Proactive Monitoring of DB Time for better Analysis

Database time is total time spent by user processes either actively working or actively waiting in a database call. To make it clearer, DB Time is the time spent in the database by foreground sessions which includes CPU time, IO time and wait time for a particular snap interval. It excludes idle wait time.
DB Time and Wait Events are directly proportional. The first thing one will be looking while reviewing the AWR is the DB time, if it is more and multiples of elapsed time then one has to jump to the TOP 5 Timed Events sessions to investigate  further.

Ideally DBAs will be reactively looking at AWR  for performance problems, but one has to Proactively look at the AWR reports periodically to see if things are fine or not. But it is very difficult to generate AWR or review AWRs for all the snap intervals of Production database as we will be having 7 X 24 AWR reports for a week (1 hour snap interval).
The following single query will help the DBAs to generate the DB time of all Snap Intervals of a week. Based on the data generated, one can identify the high DB time snaps and generate AWR reports to investigate proactively before it gets into worst.

We have automated the query which will generate Graph and mail it to the DBAs who owns the databases using the Ploticaus tool to plot graph in linux. (http://ploticus.sourceforge.net/doc/welcome.html)


In the above graph we see there is a spike , one can generate AWR and look into what went wrong at a particular snap time and correct it before it becomes major problem. This helps to monitor DB 24 X 7 .

Fine the Query  below which gets the DB time for the whole week.
col snap_id format A8
 col begin_interval_time_N format A30 trunc
 col end_interval_time_N format A30 trunc
 col HOST_NAME format A15 trunc
 col INSTANCE_NUMBER format 9 heading “I”
 col begin_interval_time_N noprint
 col end_interval_time_N noprint

 select  A.SNAP_ID , A.INSTANCE_NUMBER , C.HOST_NAME  , MIN(A.begin_interval_time) OVER (partition by A.dbid, A.snap_id) AS begin_interval_time_N  , MIN(A.end_interval_time) OVER (partition by A.dbid, A.snap_id) AS end_interval_time_N  , (B. VALUE – LAG(B.VALUE,1,0) OVER (ORDER BY A.SNAP_ID))/1000000/60 as DB_TIME  from dba_hist_snapshot A , DBA_HIST_SYS_TIME_MODEL B,dba_hist_database_instance C  where A.SNAP_ID=B.SNAP_ID  and A.DBID=B.DBID  And A.INSTANCE_NUMBER=B.INSTANCE_NUMBER  and B.STAT_NAME Like ‘DB time’  and A.DBID=C.DBID  and A.INSTANCE_NUMBER=C.INSTANCE_NUMBER  and A.startup_time = C.startup_time  and A.begin_interval_time >= trunc(sysdate) – 7 and A.begin_interval_time <= trunc(sysdate) + 20/(26*60)


Tuesday, July 19, 2011

11g Wait Events Statistics - Wait Event Histograms

Wait Event Histogram

From 11g Oracle introduced Wait Event Histograms in the AWR report. This provides DBAs more granular information in the report for efficient diagonosis.This section splits the event counts into elapsed time buckets so that we can see if there are any suspicious or anomalous response time / frequency patterns. This is a very interesting and informational view in Oracle10g when it comes to analyzing wait time per wait event.
 It shows a histogram of the number of waits, total wait time and maximum wait for each event. The bucket sizes or the time intervals in this case, for the histograms are predefined. They cannot be changed. The bucket time intervals are from < 1 ms, < 2 ms, < 4 ms, < 8 ms, < 16 ms, and so on, increasing with the power of 2, till we get to >= 2 ms. The buckets will be populatedaccordingly, and only when TIMED_STATISTICS is set to TRUE. From a very short report it produces an extremely useful addition to the information about lost time.

For any event, the less number of buckets the better because the wait times they represent are shorter. The bucket boundaries are pre-set and you cannot change their values. Also, high WAIT_COUNT numbers should be in the buckets with lower WAIT_TIME_MILLI values. If you have it the other way around, then that's the event that needs further investigation.
Another good application of this view is to monitor the SQL*Net message from client event. If the WAIT_COUNT is high for the low-end buckets then it could mean that the application is communicating a lot with the client. This may cause excessive network traffic, which could be reduced with higher ARRAYSIZE or server side processing. On the other hand, if the WAIT_COUNT is high for the high-end buckets then it is more likely due to user lag time.

Below are the screen shots of the various sections of AWR representing Wait Events Statistics.


 It is always good if you see the " No data exists " in the 4 min to 1 hr segment and 4 sec to 2 min segment.

Friday, July 15, 2011

Top 5 Timed Events - log file switch (archiving needed)

log file switch (archiving needed) -- Waiting for a log switch because the log that the LGWR will be switching into has not been archived yet. The main cause of this error is due to the non availability of space in the archive log destination.


Database is literally hung in this situation, even thought DB is not physically down, all the operations will come to a standstill affecting the uptime and availability of the system.
The best approach if one runs out of space in the archive log destination is to configure alternative location for archive log destination to avoid outages due to space issues.
Oracle has got an option to add Alternate attribute added to the log_archive_destination. Alternate archiving destination will be used if archiving to the original archiving destination fails. Below link will provide more information about the alternate option.


Thursday, July 7, 2011

11g Top 5 Timed Foregorund Events

From 11g, Oracle replaced “Top 5 Timed Events” as “Top 5 Timed Foreground Events”

Prior to Oracle 11g, wait event statistics included both foreground processes (for example, session based) and background processes (such as DBWR, SMON). It makes sense to break those different process types down into different sets of wait event statistics. He is now making clear in AWR with Foreground and Background events which will help us to focus more on foreground events.

Find below images of new names in 11g.


We will discuss more enhancements like Wait Event Histogram in next post.

Friday, June 24, 2011

AWR TOP 5 Timed Events Analysis - gc buffer busy

I already mentioned about this event in the same blog few months back. But this example is more lively in terms of finding the root cause with the help of AWR.

The gc current block busy and gc cr block busy wait events indicate that the local instance that is making the request did not immediately receive a current or consistent read block. The term "busy" in these events' names indicates that the sending of the block was delayed on a remote instance. For example, a block cannot be shipped immediately if Oracle Database has not yet written the redo for the block's changes to a log file.


In comparison to "block busy" wait events, a gc buffer busy event indicates that Oracle Database cannot immediately grant access to data that is stored in the local buffer cache. This is because a global operation on the buffer is pending and the operation has not yet completed. In other words, the buffer is busy and all other processes that are attempting to access the local buffer must wait to complete.
This AWR belongs to 3 Node RAC Architecture, we see high gc buffer busy in one of the busy nodes. You need to drill down further down in the AWR to the SQL Ordered by Cluster Wait Time section ( Fig 2)and see what query is on the top waiting for the resources. One you pick the query look for the object which is being referred in the query.


In this case we have seen a table (referred in the top sql of Cluster Wait) which is being frequently accessed by all the 3 nodes is constantly being updated by another process.

Further drill down in the AWR to 'Segments by Global Cache Buffer Busy ' to find out the object on which most of the buffer waits are being found. If the table identified in the query matches with that of the Global Cache Buffer Busy section then identify all the DML operations on that table to figure out the solution.


In our case the application is using the same table for updates and selects which is causing the issue. The other quick fix is to see that update application and select application are being routed to the same node to avoid the gc wait event. But it is always better to identify the hot block and try to fix it from the design level for the optimal solution.

Wednesday, June 8, 2011

AWR Top 5 Timed Events - Quick Reference Guide

Wait Events Quick Reference Guide

    Wait Events                                                    Wait Problem Potential Fix

DB File Scattered Read       ----  Indicates many full table scans: tune the code; cache small tables.

DB File Sequential Read      ----  Indicates many index reads: tune the code (especially joins).

Free Buffer                           --- Increase the DB_CACHE_SIZE; shorten the checkpoint; tune the code.

Buffer Busy                          ---Segment header: add freelists or freelist groups.

Buffer Busy                          ---Data block: separate "hot" data; use reverse key indexes and/or smaller
                                                  blocks.

Buffer Busy                          ---Data block: increase initrans and/or maxtrans.

Buffer Busy                          ---Undo header: add rollback segments or areas.

Buffer Busy                          ---Undo block: commit more often; use larger rollback segments or areas.

Latch Free                            ---Investigate the latch detail.

Enqueue                               ---ST Use LMTs or preallocate large extents.

Enqueue                               ---HW Preallocate extents above high-water mark.

Enqueue                               ---TX4 Increase initrans and/or maxtrans on the table or index.

Enqueue                               ---TM Index foreign keys; check application locking of tables.

Log Buffer                            ---Space Increase the log buffer; use faster disks for the redo logs.

Log File                                ---Switch Archive destination slow or full; add more or larger redo logs.

Log File Sync                        --- Commit more records at a time; use faster redo log disks .

Idle Event                              ---Ignore it.

*** Potential Fixes discussed above are subject to change based on the version/feature.

Monday, June 6, 2011

AWR Top 5 Timed Events - Top 10

Top 5 Timed Events


When you are trying to eliminate bottlenecks on your system, your AWR report’s Top 5 Timed Events section is the first place to look. This section of the report shows the top 5 timed events, the full list of wait events, and the background wait events.


The following are 10 of the most common causes for wait events, along with explanations and potential solutions:

1. DB File Scattered Read. This generally indicates waits related to full table scans. As full table scans are pulled into memory, they rarely fall into contiguous buffers but instead are scattered throughout the buffer cache. A large number here indicates that your table may have missing or suppressed indexes. Although it may be more efficient in your situation to perform a full table scan than an index scan, check to ensure that full table scans are necessary when you see these waits. Try to cache small tables to avoid reading them in over and over again, since a full table scan is put at the cold end of the LRU (Least Recently Used) list.

2. DB File Sequential Read. This event generally indicates a single block read (an index read, for example). A large number of waits here could indicate poor joining orders of tables, or unselective indexing. It is normal for this number to be large for a high-transaction, well-tuned system, but it can indicate problems in some circumstances. You should correlate this wait statistic with other known issues within the Statspack report, such as inefficient SQL. Check to ensure that index scans are necessary, and check join orders for multiple table joins. The DB_CACHE_SIZE will also be a determining factor in how often these waits show up. Problematic hash-area joins should show up in the PGA memory, but they're also memory hogs that could cause high wait numbers for sequential reads. They can also show up as direct path read/write waits. These circumstances are usually interrelated. When they occur in conjunction with the appearance of the db file scattered read and db file sequential read in the Top 5 Wait Events section, first you should examine the SQL Ordered by Physical Reads section of the report, to see if it might be helpful to tune the statements with the highest resource usage. Then, to determine whether there is a potential I/O bottleneck, examine the OS I/O statistics for corresponding symptoms. Also look at the average time per read in the Tablespace and File I/O sections of the report. If many I/O-related events appear high in the Wait Events list, re-examine the host hardware for disk bottlenecks and check the host-hardware statistics for indications that a disk reconfiguration may be of benefit.

3. Free Buffer. This indicates your system is waiting for a buffer in memory, because none is currently available. Waits in this category may indicate that you need to increase the DB_BUFFER_CACHE, if all your SQL is tuned. Free buffer waits could also indicate that unselective SQL is causing data to flood the buffer cache with index blocks, leaving none for this particular statement that is waiting for the system to process. This normally indicates that there is a substantial amount of DML (insert/update/delete) being done and that the Database Writer (DBWR) is not writing quickly enough; the buffer cache could be full of multiple versions of the same buffer, causing great inefficiency. To address this, you may want to consider accelerating incremental checkpointing, using more DBWR processes, or increasing the number of physical disks. To investigate if this is an I/O problem, look at the statspack file I/O Statistics.

4. Buffer Busy. This is a wait for a buffer that is being used in an unshareable way or is being read into the buffer cache. Buffer busy waits should not be greater than 1 percent. Check the Buffer Wait Statistics section (or V$WAITSTAT) to find out if the wait is on a segment header. If this is the case, increase the freelist groups or increase the pctused to pctfree gap. If the wait is on an undo header, you can address this by adding rollback segments; if it's on an undo block, you need to reduce the data density on the table driving this consistent read or increase the DB_CACHE_SIZE. If the wait is on a data block, you can move data to another block to avoid this hot block, increase the freelists on the table, or use Locally Managed Tablespaces (LMTs). If it's on an index block, you should rebuild the index, partition the index, or use a reverse key index. To prevent buffer busy waits related to data blocks, you can also use a smaller block size: fewer records fall within a single block in this case, so it's not as "hot." When a DML (insert/update/ delete) occurs, Oracle Database writes information into the block, including all users who are "interested" in the state of the block (Interested Transaction List, ITL). To decrease waits in this area, you can increase the initrans, which will create the space in the block to allow multiple ITL slots. You can also increase the pctfree on the table where this block exists (this writes the ITL information up to the number specified by maxtrans, when there are not enough slots built with the initrans that is specified).

5. Latch Free. Latches are low-level queuing mechanisms (they're accurately referred to as mutual exclusion mechanisms) used to protect shared memory structures in the system global area (SGA). Latches are like locks on memory that are very quickly obtained and released. Latches are used to prevent concurrent access to a shared memory structure. If the latch is not available, a latch free miss is recorded. Most latch problems are related to the failure to use bind variables (library cache latch), redo generation issues (redo allocation latch), buffer cache contention issues (cache buffers LRU chain), and hot blocks in the buffer cache (cache buffers chain). There are also latch waits related to bugs; check MetaLink for bug reports if you suspect this is the case (oracle.com/support ). When latch miss ratios are greater than 0.5 percent, you should investigate the issue. I will cover latch waits in detail in my next Oracle Magazine column; the topic requires an article in itself. If latch free waits are in the Top 5 Wait Events or high in the complete Wait Events list, look at the latch-specific sections of the Statspack report to see which latches are contended for.

6. Enqueue. An enqueue is a lock that protects a shared resource. Locks protect shared resources, such as data in a record, to prevent two people from updating the same data at the same time. An enqueue includes a queuing mechanism, which is FIFO (first in, first out). Note that Oracle's latching mechanism is not FIFO. Enqueue waits usually point to the ST enqueue, the HW enqueue, the TX4 enqueue, and the TM enqueue. The ST enqueue is used for space management and allocation for dictionary-managed tablespaces. Use LMTs, or try to preallocate extents or at least make the next extent larger for problematic dictionary-managed tablespaces. HW enqueues are used with the high-water mark of a segment; manually allocating the extents can circumvent this wait. TX4s are the most common enqueue waits. TX4 enqueue waits are usually the result of one of three issues. The first issue is duplicates in a unique index; you need to commit/rollback to free the enqueue. The second is multiple updates to the same bitmap index fragment. Since a single bitmap fragment may contain multiple rowids, you need to issue a commit or rollback to free the enqueue when multiple users are trying to update the same fragment. The third and most likely issue is when multiple users are updating the same block. If there are no free ITL slots, a block-level lock could occur. You can easily avoid this scenario by increasing the initrans and/or maxtrans to allow multiple ITL slots and/or by increasing the pctfree on the table. Finally, TM enqueues occur during DML to prevent DDL to the affected object. If you have foreign keys, be sure to index them to avoid this general locking issue.

7. Log Buffer Space. This wait occurs because you are writing the log buffer faster than LGWR can write it to the redo logs, or because log switches are too slow. To address this problem, increase the size of the log files, or increase the size of the log buffer, or get faster disks to write to. You might even consider using solid-state disks, for their high speed.

8. Log File Switch. All commit requests are waiting for "logfile switch (archiving needed)" or "logfile switch (chkpt. Incomplete)." Ensure that the archive disk is not full or slow. DBWR may be too slow because of I/O. You may need to add more or larger redo logs, and you may potentially need to add database writers if the DBWR is the problem.

9. Log File Sync. When a user commits or rolls back data, the LGWR flushes the session's redo from the log buffer to the redo logs. The log file sync process must wait for this to successfully complete. To reduce wait events here, try to commit more records (try to commit a batch of 50 instead of one at a time, for example). Put redo logs on a faster disk, or alternate redo logs on different physical disks, to reduce the archiving effect on LGWR. Don't use RAID 5, since it is very slow for applications that write a lot; potentially consider using file system direct I/O or raw devices, which are very fast at writing information.

10. Idle Event. There are several idle wait events listed after the output; you can ignore them. Idle events are generally listed at the bottom of each section and include such things as SQL*Net message to/from client and other background-related timings. Idle events are listed in the stats$idle_event table.