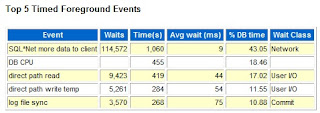
Top 5 Timed Foreground Events - cursor: pin S wait on X

This wait event will occur in mulitple scenarios, In 10g we have observes this is due to the frequent Automatic Memory Management Resize operations. Setting the SGA_TARGET to zero solved the problem. There are many bugs in versions of 10g versions. (The bug is tracked as Bug 6528336 – LARGE NUMBER OF SESSIONS WAITING ON CURSOR: PIN S WAIT ON X)
This has been fixed in further releases of 10g and 11g.
We received the above error while performing the load test in our environment in 11g R2 and the below query has helped us in identifing sql responsible for this.
from v$session where event ='cursor: pin S wait on X'
SID SERIAL# SQL_ID BLOCKING_SESSION BLOCKING_SESSION_STATUS EVENT
---- ------- ------------- ---------------- ----------------------- ----------
125 8190 3d3pd7g7dwuf6 135 VALID cursor: pin S wait on X
One of the most likely causes of cursor: pin S wait on X is high parsing time. Therefore the reason for the high parse time should be investigated.
11g R1 Below Diagonosis
Cursor: pin S wait on X.
A session waits on this event when requesting a mutex for shareable operations related to pins (such as executing a cursor), but the mutex cannot be granted because it is being held exclusively by another session (which is most likely parsing the cursor). 
This wait event will occur in mulitple scenarios, In 10g we have observes this is due to the frequent Automatic Memory Management Resize operations. Setting the SGA_TARGET to zero solved the problem. There are many bugs in versions of 10g versions. (The bug is tracked as Bug 6528336 – LARGE NUMBER OF SESSIONS WAITING ON CURSOR: PIN S WAIT ON X)
This has been fixed in further releases of 10g and 11g.
We received the above error while performing the load test in our environment in 11g R2 and the below query has helped us in identifing sql responsible for this.
In 11g R2, the blocking session can be found directly using the following sql:
SQL> select sid,serial#,SQL_ID,BLOCKING_SESSION,BLOCKING_SESSION_STATUS,EVENT from v$session where event ='cursor: pin S wait on X'
SID SERIAL# SQL_ID BLOCKING_SESSION BLOCKING_SESSION_STATUS EVENT
---- ------- ------------- ---------------- ----------------------- ----------
125 8190 3d3pd7g7dwuf6 135 VALID cursor: pin S wait on X
One of the most likely causes of cursor: pin S wait on X is high parsing time. Therefore the reason for the high parse time should be investigated.
11g R1 Below Diagonosis
As a result of Bug 7568642 BLOCKING_SESSION EMPTY FOR "CURSOR: PIN S WAIT ON X" the blocking_session is not populated in 10.2.The bug is fixed in 11g R1. Below approach can be used to idetify the necessary sql causing this wait.
The column P2RAW in v$session or v$session_wait gives the blocking session for wait event cursor: pin S wait on X.
The top bytes of p2raw is the blocker. It is in hex so needs to be converted in decimal.
SQL> select p2raw from v$session where event = 'cursor: pin S wait on X';
P2RAW
----------------
0000001F00000000
P2RAW
----------------
0000001F00000000
The top bytes of p2raw is the blocker.
Taking 0000001F (the first 8 bytes) and converting to decimal gives session id 31.
Taking 0000001F (the first 8 bytes) and converting to decimal gives session id 31.
Or simply:
SQL> select p2raw,to_number(substr(to_char(rawtohex(p2raw)),1,8),'XXXXXXXX') sid
from v$session
where event = 'cursor: pin S wait on X';
P2RAW SID
---------------- ---
0000001F00000000 31
from v$session
where event = 'cursor: pin S wait on X';
P2RAW SID
---------------- ---
0000001F00000000 31
SQL> select p1, p2raw, count(*) from v$session
where event ='cursor: pin S wait on X'
and wait_time = 0
group by p1, p2raw;
where event ='cursor: pin S wait on X'
and wait_time = 0
group by p1, p2raw;
p1 = the mutex Id
This has the same definition as v$mutex_sleep_history.mutex_identifier
This has the same definition as v$mutex_sleep_history.mutex_identifier
- p2raw = holding Session Id | Ref Count The most significant bytes always store the Holding Session Id (Holding SId). The least significant bytes always store the Ref Count.
The blocking session can be queried to see what it is doing and if anyone is blocking it.
SQL> select sid,serial#,SQL_ID,BLOCKING_SESSION,BLOCKING_SESSION_STATUS,EVENT
from v$session where SID=31
from v$session where SID=31