Search Oracle Related Sites

Wednesday, December 28, 2011

TOP 5 Timed Events - ARCH wait on SENDREQ

ARCH wait on SENDREQ -- Is Network related Wait event at Primary database side when a standby database is configured. ARCH wait on SENDREQ monitors the amount of time spent by all archiver processes to write the received redo to disk as well as open and close the remote archived redo logs

There are three things one can do if you have high wait time against this wait event.

1) Optimize the Network -

Overall, the goal for all Data Guard configurations is to ship redo data to the remote disaster recovery site fast enough to meet recovery time and recovery point objectives. If there is insufficient bandwidth available to handle the required volume however, no amount of tuning can achieve this goal. In order to figure out how much bandwidth is needed, the volume of data that is generated by the production database will need to be determined. Ideally, this can be found by measuring an existing production database or a database which has been set up in a test environment.

SDU (SESSION DATA UNIT)
Before sending data across the network, Oracle Net buffers data into the Session Data Unit (SDU). When large amounts of data are being transmitted or when the message size is consistent, increasing the size of the SDU buffer can improve performance and network utilization. You can configure SDU size within an Oracle Net connect descriptor or globally within the sqlnet.ora.
For Data Guard broker configurations configure the DEFAULT_SDU_SIZE parameter in the sqlnet.ora file:
DEFAULT_SDU_SIZE=32767

For non Data Guard broker configurations that use a connect descriptor, you can override the current settings in the primary database sqlnet.ora file. If you are setting the SDU in a connect descriptor you must use a static SID. Using a dynamic service registration will use the default SDU size defined by DEFAULT_SDU_SIZE. This example uses a connect descriptor with the SDU parameter in the description.
sales.us.acme.com=
(DESCRIPTION=
(SDU=32767)
(ADDRESS=(PROTOCOL=tcp)
(HOST=sales-server)
(PORT=1521))
(CONNECT_DATA=
(SID=sales.us.acme.com))
)
On the standby database, set SDU in the SID_LIST of the listener.ora file:
SID_LIST_listener_name=
(SID_LIST=
(SID_DESC=
(SDU=32767)
(GLOBAL_DBNAME=sales.us.acme.com)
(SID_NAME=sales)
(ORACLE_HOME=/usr/oracle)))
2) Multiple archive processes can transmit a redo log in parallel to the standby database, reducing the time for the redo transmission to the secondary. The MAX_CONNECTIONS attribute of the LOG_ARCHIVE_DEST_n control the number of these processes. This can be very beneficial during batch loads.

3)A system's network queues sizes can also be adjusted to optimize performance. You can regulate the size of the queue between the kernel network subsystems and the driver for network interface card. Any queue should be sized so that losses do not occur due to local buffer overflows. Therefore, careful tuning is required to ensure that the sizes of the queues are optimal for your network connection, particularly for high bandwidth networks.

These settings are especially important for TCP because losses on local queues cause TCP to fall into congestion control, which limits the TCP sending rates.
For Linux there are two queues to consider, the interface transmit queue and the network receive queue. The transmit queue size is configured with the network interface option txqueuelen. The network receive queue size is configured with the kernel parameter netdev_max_backlog
----- Find below more events related to Standby Database on Primary and Standby sides.----

WAIT EVENTS ON THE PRIMARY

On the primary database there are two categories of wait events which are either related to the ARC process or the LGWR process. The descriptions of these events are below.
1. ARCH PROCESS WAIT EVENTS
ARCH wait on ATTACH monitors the amount of time spent by all archiver processes to spawn an RFS connection.
ARCH wait on SENDREQ monitors the amount of time spent by all archiver processes to write the received redo to disk as well as open and close the remote archived redo logs.
ARCH wait on DETACH monitors the amount of time spent by all archiver processes to delete an
RFS connection.

2. LGWR SYNC WAIT EVENTS
LGWR wait on ATTACH monitors the amount of time spent by all log writer processes to spawn an RFS connection.
LGWR wait on SENDREQ monitors the amount of time spent by all log writer processes to write the received redo to disk as well as open and close the remote archived redo logs.
LGWR wait on DETACH monitors the amount of time spent by all log writer processes to delete an RFS connection.

3. LGWR ASYNC WAIT EVENTS
LNS wait on ATTACH monitors the amount of time spent by all network servers to spawn an RFS connection. 
LNS wait on SENDREQ monitors the amount of time spent by all network servers to write the received redo to disk as well  as open and close the remote archived redo logs.
LNS wait on DETACH monitors the amount of time spent by all network servers to delete an RFS connection.

LGWR wait on full LNS buffer monitors the amount of time spent by the log writer (LGWR) process waiting for the network server (LNS) to free up ASYNC buffer space. If buffer space has not been freed in a reasonable amount of time, availability of the primary database is not compromised by allowing the archiver process (ARCn) to transmit the redo log data. This wait event is not relevant for destinations configured with the LGWR SYNC=PARALLEL attributes.

WAIT EVENTS ON THE SECONDARY

RFS Write is the elapsed time for the write to standby redo log or archive log to occur as well as non I/O work such as redo   block checksum validation.

RFS Random I/O is the elapsed time for the write to a standby redo log to occur.

RFS Sequential I/O is the elapsed time for the write to an archive log to occur.

Tuesday, December 20, 2011

SQL ordered by Version Count

This time i want to discuss about the SQL ordered by Version Count under Sql Statistics of AWR as it is hard finding the different TOP Wait Events in AWRs. This needs a little explanation as most of us worry what the queries under this section fall into.


In the above we see query has 204 version count and has more than 165 executions. First thing to start with looking at the sql text and see if the bind variables are being used or not. If they are being used then we need to look for the cuase of having many child cursors for that query.

As the definition SQL Ordered by Version Count - AWR reports statements with more than child cursors than the threshold value which defaults to 20.

There are so many reasons why Oracle does not share the same statement. Oracle records the reason in v$sql_shared_cursor view. In 10.2.0.1 database, v$sql_shared_cursor has 53 reasons of unshareability.
V$SQL_SHARED_CURSOR explains why a particular child cursor is not shared with existing child cursors. Each column identifies a specific reason why the cursor cannot be shared.

I have done the same found that the reason for above sql in the image is due to Bind Mismatch. I  have gone through many blogs including the blog below of Jonathan which beautifully explains the reasons behind the bind mismatch for columns with varchar.


Unfortunately my column in the query ( Above Image ) is a number field and explanation of the above link does not suite my situation. But i found that this is one of the busy queries hit by my application and the reason for Bind Mismatch in this situation is due to the heavy activity in shared pool. This is becuase when a session attempts to validate a cursor and finds it has to wait for a pin then it may simply generate a new child rather than waiting which is causing for creation of new child cursor.

Other reasons might be -  if the optimizer environments are different you get different child cursors - even if the final plan is the same - check the column on v$sql, and the content of  $sql_optimizer_env or
 there are various bugs that cause child cursors to be created unnecessarily in various versions from 10.2.0.1.

Find below the little explanation on Parent and Child Cursors which is very interesting in this context from Steve Adams.


"For each SQL statement the library cache contains a "parent" cursor for the text of the SQL statement.

The parent cursor is comprised of a "handle" that can be looked up by hash value via the library cache hash table, and an "object" that contains pointers to each of its "child" cursors. Each child cursor is also comprised of a handle and an object. The child object is comprised of two heaps numbered 0 and 6. Heap 0 contains all the identifying information for a particular version of the SQL statement and heap 6 contains the execution plan. This distinction between parent and child cursors is maintained even when there is only one version of each SQL statement.

For parent cursors the convention used in the X$ tables is that the parent address is the same as the handle address. V$OPEN_CURSORS, V$SQL and so on are only interested in child cursors and so they exclude parent cursors by requiring that the two addresses are different. The columns that you mentioned are of course the two addresses."


Friday, December 9, 2011

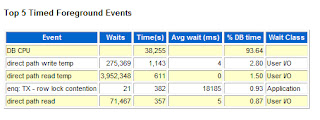
Top 5 Timed Foreground Events - direct path read temp

Direct Path Read Temp

When a session reads buffers from disk directly into the PGA, the wait is on direct path read temp. This is closely related to the direct path read wait. If the I/O subsystem doesn’t support asynchronous I/Os, then each wait corresponds to a physical read request. If the I/O subsystem supports asynchronous I/O, then the process overlaps read requests with processing the blocks already in the PGA. When the process attempts to access a block in the PGA that has not yet been read from disk, it issues a wait call and updates the statistics for this event. So, the number of waits is not always the same as the number of read requests.
Similarly, the direct path write temp wait event and direct path write wait event can occur when a process is writing buffers directly from PGA. The process will wait on this event for the write call to complete. Operations that could perform direct path writes include when a sort goes to disk, parallel DML operations, direct-path INSERTs, parallel create table as select, and some LOB operations. Like direct path reads, the number of waits is not the same as number of write calls issued if the I/O subsystem supports asynchronous writes. The session will wait if it has processed the buffers in the PGA and can’t continue work until an I/O request completes.
Causes for the direct path read temp wait
To reduce the direct path read wait event and direct path read temp wait event:
§  High disk sorts – If the sorts are too large to fit in memory and get sent to disk, this wait can occur.
§  Parallel slaves – Parallel slaves are used for scanning data or parallel DML may be used to create and populate objects. These may lead to direct path read wait and direct path write wait respectively.
§  Direct path loads – The direct path API is used to pass data to the load engine in the server and can cause the related direct path write wait.
§  Server process ahead of I/O – The server process is processing buffers faster than the I/O system can return the buffers. This can indicate an overloaded I/O system
§  Data Warehouse – Sorts in a data warehouse environment may always go to disk leading to high waits on direct path read temp and/or direct path write temp.
§  Hash area size – For query plans that call for a hash join, excessive I/O could result from having HASH_AREA_SIZE too small.
One can go down the AWR to the IO Stats Section to see what is causing these wait events.
Under IO Stats , IO Stat by FileType Summary we see that Temp is on the TOP with Major Volume of Data Writes and Reads.


      High disk sorts – The disk sort distribution can be checked: It is recommended to use pga_aggregate_target. This area is used both for sorts and the hash join area. If    possible the PGA can be sized larger to fit more in-memory sorts reducing the disk sorts. Memory_Target can be increased if required.
   Full Table Scans – If tables are defined with a high degree of parallelism, the optimizer leans towards using full table scans with parallel slaves. For a direct path read, locate the object being loaded. Consider using disk striping or Automatic Storage Management (ASM) which can stripe for you.
  Parallel DML – Check the I/O distribution across the disks and make sure your I/O is configured for the parallelism being used. Verify that the parameter DISK_ASYNCH_IO is set to true.
The direct path read temp wait is most often encountered when the PGA is not able to support the size of the sorts. The closely related wait events of direct path read, direct path write temp, and direct path write can occur due to parallel operations, direct path inserts and overloaded I/O. But tuning the PGA, the I/O placement, and SQL tuning can reduce or eliminate this wait.

Wednesday, November 23, 2011

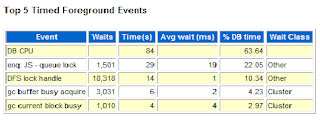
AWR TOP 5 Timed Events - DFS lock handle


DFS lock handle

The session waits for the lock handle of a global lock request. The lock handle identifies a global lock. With this lock handle, other operations can be performed on this global lock (to identify the global lock in future operations such as conversions or release). The global lock is maintained by the DLM.

Oracle is waiting for the lock handle. The lock handle identifies a lock that is currently held. This lock handle is obtained from the lock state on the initial acquisition and may be used to reconstruct the state for conversion or release. This event is called if we are getting a lock and we want to know the lock handle (to identify the lock in future operations like conversions or release). The lock is maintained by the DLM.

Wait Time:
The session waits in a loop until it has obtained the lock handle from the DLM. Inside the loop there is a wait of 0.5 seconds.

Parameter Description
name Lock Name
mode Lock Mode
id1 ID1 (varies depends on Lock name)
id2 ID2 (varies depends on Lock name)


DFS lock handle is a wait event is associated with many different areas of database software code. It is important to identify the lock type, id1,id2 and understand the problem to resolve the root cause. Of course, many of these issues can be a new or already-identified software bugs too.

Mostly the DFS lock handle is associated with Sequences in RAC. When diagnosing issues with sequences, you are likely to observe heavy Global Enqueue Services traffic due to Global TX and TM enqueues, contenTon for the SQ enqueue, waits on “DFS Lock Handle”, and/or high wait Tmes for “row cache lock”. Besides adjusTng the CACHE value for sequences to be higher, you should also consider using DBMS_SHARED_POOL.KEEP to pin the sequence in the shared pool rowcache and reviewing your indexes performance for possible block split contenTon.


Monday, November 21, 2011

Top 5 Timed Events - log file switch (checkpoint incomplete)

Top 5 Timed Events - log file switch (checkpoint incomplete)


Waits for this wait indicates that the process is waiting for the log file switch to complete, but the log file switch is not possible because the checkpoint process for that log file has not completed. You may see this event when the redo log files are sized too small. One has to go below the AWR and look for log swtiches. Ideally the log switches should be 2 or 3 for hour.


The log switches under the Instance Activity Stats show that there are 33 switches happened during an hour which mean every 2 minutes there is switch. We need to increase the size of the online redo log files to get rid of this wait event as well as improve the performance of the database.

Friday, November 11, 2011

Top 5 Timed Events - db file sequential read

Top 5 Timed Events - db file sequential read
The db file sequential read wait event occurs when it has to wait for a single-block I/O read request to complete. Oracle issues single-block I/O read requests when reading from indexes, rollback segments, sort segments, controlfiles, datafile headers and tables (when tables are accessed via rowids).

The db file sequential read and db file scattered read events can be always confusing for everybody, as the sequential read is associated with index read and the scattered read has to do with full table scans. It seems like they would have to be the other way around. The db file sequential read is thus named because it reads blocks into contiguous memory, and the db file scattered read gets its name because it reads multiple blocks and scatters them into the Buffer Cache.


Causes and Actions

The following discusses the common causes of db file sequential read waits that result from index reads.

Physical I/O requests for index blocks are perfectly normal and so the presence of the db file sequential read waits do not necessarily mean that there is something wrong with the database or the application. The issue is not index reads, rather it is the waits that are caused by excessive and unwarranted index reads. The performance degradation is magnified by slow I/O subsystem and/or poor datafiles layout. The DBA should be concerned with the average I/O time and SQL statements that spend a lot of time on this wait event.

Newer storage subsystems should offer an average single-block I/O wait that does not exceed 1 centisecond (1/100 second). Query the V$SYSTEM_EVENT view for the average wait of your database. If the average I/O wait far exceeds this allowance, this could mean the storage subsystem is slow or the database files are poorly placed. This is a database issue and the DBA should verify that the system is properly configured by examining the mapping of database files to mount points, and mount points to physical disks and I/O controllers. The idea is to avoid hot spots. Datafiles should be created on LUNs (Disk Logical Unit Number) that are striped over enough disks, and mount points should be distributed across all available I/O controllers and busses.

If the average I/O wait time for the db file sequential read event is acceptable, but the event represents a significant portion of waits in a certain session, then this is an application issue. In this case, the DBA needs to determine which index is being read the most from the P1 and P2 values, identify the SQL statement, generate and examine the explain plan against the SQL predicates, and advise on tuning. Should the query access data through an index? Would a full table scan be more efficient? Does the query use the right driving table? The objective is to reduce both the logical and physical I/O calls, and this can be best achieved through SQL and application tuning.

The introduction of a new index in the database where the Stored Outline feature is not used may cause the optimizer to select a plan that uses the index, and depending on the SQL statement, could result in significant I/O wait time.

Out-of-date statistics can certainly induce the optimizer to generate poor execution plans, which may call for index reads when they shouldn't. Make sure all object statistics are kept up to date.


Wednesday, October 26, 2011

Top 5 Timed Foreground Events - enq: JS - queue lock

Top 5 Timed Foreground Events - enq: JS - queue lock
The enq: JS – queue lock is Lock on internal scheduler queue where one has to look the jobs scheduled thru DBMS Scheduler.


An enqueue is a lock that protects a shared resource. Locks protect shared resources, such as data in a record, to prevent two people from updating the same data at the same time. An enqueue includes a queuing mechanism, which is FIFO (first in, first out). Note that Oracle's latching mechanism is not FIFO. Enqueue waits usually point to the ST enqueue, the HW enqueue, the TX4 enqueue, and the TM enqueue.
The ST enqueue is used for space management and allocation for dictionary-managed tablespaces. Use LMTs, or try to preallocate extents or at least make the next extent larger for problematic dictionary-managed tablespaces. HW enqueue’s are used with the high-water mark of a segment; manually allocating the extents can circumvent this wait. TX4s are the most common enqueue waits. TX4 enqueue waits are usually the result of one of three issues.
Just found a useful list of Oracle 11g enqueue waits in the web which I want to share with you, this gives us the first hand information of the enqueue locks.

Enqueue Type Description
enq: AD – allocate AU Synchronizes accesses to a specific OSM disk AU
enq: AD – deallocate AU Synchronizes accesses to a specific OSM disk AU
enq: AF – task serialization This enqueue is used to serialize access to an advisor task
enq: AG – contention Synchronizes generation use of a particular workspace
enq: AO – contention Synchronizes access to objects and scalar variables
enq: AS – contention Synchronizes new service activation
enq: AT – contention Serializes ‘alter tablespace’ operations
enq: AW – AW$ table lock Global access synchronization to the AW$ table
enq: AW – AW generation lock In-use generation state for a particular workspace
enq: AW – user access for AW Synchronizes user accesses to a particular workspace
enq: AW – AW state lock Row lock synchronization for the AW$ table
enq: BR – file shrink Lock held to prevent file from decreasing in physical size during RMAN backup
enq: BR – proxy-copy Lock held to allow cleanup from backup mode during an RMAN proxy-copy backup
enq: CF – contention Synchronizes accesses to the controlfile
enq: CI – contention Coordinates cross-instance function invocations
enq: CL – drop label Synchronizes accesses to label cache when dropping a label
enq: CL – compare labels Synchronizes accesses to label cache for label comparison
enq: CM – gate Serialize access to instance enqueue
enq: CM – instance Indicate OSM disk group is mounted
enq: CT – global space management Lock held during change tracking space management operations that affect the entire change tracking file
enq: CT – state Lock held while enabling or disabling change tracking, to ensure that it is only enabled or disabled by one user at a time
enq: CT – state change gate 2 Lock held while enabling or disabling change tracking in RAC
enq: CT – reading Lock held to ensure that change tracking data remains in existence until a reader is done with it
enq: CT – CTWR process start/stop Lock held to ensure that only one CTWR process is started in a single instance
enq: CT – state change gate 1 Lock held while enabling or disabling change tracking in RAC
enq: CT – change stream ownership Lock held by one instance while change tracking is enabled, to guarantee access to thread-specific resources
enq: CT – local space management Lock held during change tracking space management operations that affect just the data for one thread
enq: CU – contention Recovers cursors in case of death while compiling
enq: DB – contention Synchronizes modification of database wide supplemental logging attributes
enq: DD – contention Synchronizes local accesses to ASM disk groups
enq: DF – contention Enqueue held by foreground or DBWR when a datafile is brought online in RAC
enq: DG – contention Synchronizes accesses to ASM disk groups
enq: DL – contention Lock to prevent index DDL during direct load
enq: DM – contention Enqueue held by foreground or DBWR to synchronize database mount/open with other operations
enq: DN – contention Serializes group number generations
enq: DP – contention Synchronizes access to LDAP parameters
enq: DR – contention Serializes the active distributed recovery operation
enq: DS – contention Prevents a database suspend during LMON reconfiguration
enq: DT – contention Serializes changing the default temporary table space and user creation
enq: DV – contention Synchronizes access to lower-version Diana (PL/SQL intermediate representation)
enq: DX – contention Serializes tightly coupled distributed transaction branches
enq: FA – access file Synchronizes accesses to open ASM files
enq: FB – contention Ensures that only one process can format data blocks in auto segment space managed tablespaces
enq: FC – open an ACD thread LGWR opens an ACD thread
enq: FC – recover an ACD thread SMON recovers an ACD thread
enq: FD – Marker generation Synchronization
enq: FD – Flashback coordinator Synchronization
enq: FD – Tablespace flashback on/off Synchronization
enq: FD – Flashback on/off Synchronization
enq: FG – serialize ACD relocate Only 1 process in the cluster may do ACD relocation in a disk group
enq: FG – LGWR redo generation enq race Resolve race condition to acquire Disk Group Redo Generation Enqueue
enq: FG – FG redo generation enq race Resolve race condition to acquire Disk Group Redo Generation Enqueue
enq: FL – Flashback database log Synchronization
enq: FL – Flashback db command Enqueue used to synchronize Flashback Database and deletion of flashback logs.
enq: FM – contention Synchronizes access to global file mapping state
enq: FR – contention Begin recovery of disk group
enq: FS – contention Enqueue used to synchronize recovery and file operations or synchronize dictionary check
enq: FT – allow LGWR writes Allow LGWR to generate redo in this thread
enq: FT – disable LGWR writes Prevent LGWR from generating redo in this thread
enq: FU – contention This enqueue is used to serialize the capture of the DB Feature, Usage and High Water Mark Statistics
enq: HD – contention Serializes accesses to ASM SGA data structures
enq: HP – contention Synchronizes accesses to queue pages
enq: HQ – contention Synchronizes the creation of new queue IDs
enq: HV – contention Lock used to broker the high water mark during parallel inserts
enq: HW – contention Lock used to broker the high water mark during parallel inserts
enq: IA – contention  
enq: ID – contention Lock held to prevent other processes from performing controlfile transaction while NID is running
enq: IL – contention Synchronizes accesses to internal label data structures
enq: IM – contention for blr Serializes block recovery for IMU txn
enq: IR – contention Synchronizes instance recovery
enq: IR – contention2 Synchronizes parallel instance recovery and shutdown immediate
enq: IS – contention Enqueue used to synchronize instance state changes
enq: IT – contention Synchronizes accesses to a temp object’s metadata
enq: JD – contention Synchronizes dates between job queue coordinator and slave processes
enq: JI – contention Lock held during materialized view operations (like refresh, alter) to prevent concurrent operations on the same materialized view
enq: JQ – contention Lock to prevent multiple instances from running a single job
enq: JS – contention Synchronizes accesses to the job cache
enq: JS – coord post lock Lock for coordinator posting
enq: JS – global wdw lock Lock acquired when doing wdw ddl
enq: JS – job chain evaluate lock Lock when job chain evaluated for steps to create
enq: JS – q mem clnup lck Lock obtained when cleaning up q memory
enq: JS – slave enq get lock2 Get run info locks before slv objget
enq: JS – slave enq get lock1 Slave locks exec pre to sess strt
enq: JS – running job cnt lock3 Lock to set running job count epost
enq: JS – running job cnt lock2 Lock to set running job count epre
enq: JS – running job cnt lock Lock to get running job count
enq: JS – coord rcv lock Lock when coord receives msg
enq: JS – queue lock Lock on internal scheduler queue
enq: JS – job run lock – synchronize Lock to prevent job from running elsewhere
enq: JS – job recov lock Lock to recover jobs running on crashed RAC inst
enq: KK – context Lock held by open redo thread, used by other instances to force a log switch
enq: KM – contention Synchronizes various Resource Manager operations
enq: KP – contention Synchronizes kupp process startup
enq: KT – contention Synchronizes accesses to the current Resource Manager plan
enq: MD – contention Lock held during materialized view log DDL statements
enq: MH – contention Lock used for recovery when setting Mail Host for AQ e-mail notifications
enq: ML – contention Lock used for recovery when setting Mail Port for AQ e-mail notifications
enq: MN – contention Synchronizes updates to the LogMiner dictionary and prevents multiple instances from preparing the same LogMiner session
enq: MR – contention Lock used to coordinate media recovery with other uses of datafiles
enq: MS – contention Lock held during materialized view refresh to setup MV log
enq: MW – contention This enqueue is used to serialize the calibration of the manageability schedules with the Maintenance Window
enq: OC – contention Synchronizes write accesses to the outline cache
enq: OL – contention Synchronizes accesses to a particular outline name
enq: OQ – xsoqhiAlloc Synchronizes access to olapi history allocation
enq: OQ – xsoqhiClose Synchronizes access to olapi history closing
enq: OQ – xsoqhistrecb Synchronizes access to olapi history globals
enq: OQ – xsoqhiFlush Synchronizes access to olapi history flushing
enq: OQ – xsoq*histrecb Synchronizes access to olapi history parameter CB
enq: PD – contention Prevents others from updating the same property
enq: PE – contention Synchronizes system parameter updates
enq: PF – contention Synchronizes accesses to the password file
enq: PG – contention Synchronizes global system parameter updates
enq: PH – contention Lock used for recovery when setting Proxy for AQ HTTP notifications
enq: PI – contention Communicates remote Parallel Execution Server Process creation status
enq: PL – contention Coordinates plug-in operation of transportable tablespaces
enq: PR – contention Synchronizes process startup
enq: PS – contention Parallel Execution Server Process reservation and synchronization
enq: PT – contention Synchronizes access to ASM PST metadata
enq: PV – syncstart Synchronizes slave start shutdown
enq: PV – syncshut Synchronizes instance shutdown_slvstart
enq: PW – perwarm status in dbw0 DBWR 0 holds enqueue indicating prewarmed buffers present in cache
enq: PW – flush prewarm buffers Direct Load needs to flush pre-warmed buffers if DBWR 0 holds enqueue
enq: RB – contention Serializes OSM rollback recovery operations
enq: RF – synch: per-SGA Broker metadata Ensures r/w atomicity of DG configuration metadata per unique SGA
enq: RF – synchronization: critical ai Synchronizes critical apply instance among primary instances
enq: RF – new AI Synchronizes selection of the new apply instance
enq: RF – synchronization: chief Anoints 1 instance’s DMON as chief to other instances’ DMONs
enq: RF – synchronization: HC master Anoints 1 instance’s DMON as health check master
enq: RF – synchronization: aifo master Synchronizes apply instance failure detection and fail over operation
enq: RF – atomicity Ensures atomicity of log transport setup
enq: RN – contention Coordinates nab computations of online logs during recovery
enq: RO – contention Coordinates flushing of multiple objects
enq: RO – fast object reuse Coordinates fast object reuse
enq: RP – contention Enqueue held when resilvering is needed or when data block is repaired from mirror
enq: RS – file delete Lock held to prevent file from accessing during space reclamation
enq: RS – persist alert level Lock held to make alert level persistent
enq: RS – write alert level Lock held to write alert level
enq: RS – read alert level Lock held to read alert level
enq: RS – prevent aging list update Lock held to prevent aging list update
enq: RS – record reuse Lock held to prevent file from accessing while reusing circular record
enq: RS – prevent file delete Lock held to prevent deleting file to reclaim space
enq: RT – contention Thread locks held by LGWR, DBW0, and RVWR to indicate mounted or open status
enq: SB – contention Synchronizes Logical Standby metadata operations
enq: SF – contention Lock used for recovery when setting Sender for AQ e-mail notifications
enq: SH – contention Should seldom see this contention as this Enqueue is always acquired in no-wait mode
enq: SI – contention Prevents multiple streams table instantiations
enq: SK – contention Serialize shrink of a segment
enq: SQ – contention Lock to ensure that only one process can replenish the sequence cache
enq: SR – contention Coordinates replication / streams operations
enq: SS – contention Ensures that sort segments created during parallel DML operations aren’t prematurely cleaned up
enq: ST – contention Synchronizes space management activities in dictionary-managed tablespaces
enq: SU – contention Serializes access to SaveUndo Segment
enq: SW – contention Coordinates the ‘alter system suspend’ operation
enq: TA – contention Serializes operations on undo segments and undo tablespaces
enq: TB – SQL Tuning Base Cache Update Synchronizes writes to the SQL Tuning Base Existence Cache
enq: TB – SQL Tuning Base Cache Load Synchronizes writes to the SQL Tuning Base Existence Cache
enq: TC – contention Lock held to guarantee uniqueness of a tablespace checkpoint
enq: TC – contention2 Lock of setup of a unique tablespace checkpoint in null mode
enq: TD – KTF dump entries KTF dumping time/scn mappings in SMON_SCN_TIME table
enq: TE – KTF broadcast KTF broadcasting
enq: TF – contention Serializes dropping of a temporary file
enq: TL – contention Serializes threshold log table read and update
enq: TM – contention Synchronizes accesses to an object
enq: TO – contention Synchronizes DDL and DML operations on a temp object
enq: TQ – TM contention TM access to the queue table
enq: TQ – DDL contention TM access to the queue table
enq: TQ – INI contention TM access to the queue table
enq: TS – contention Serializes accesses to temp segments
enq: TT – contention Serializes DDL operations on tablespaces
enq: TW – contention Lock held by one instance to wait for transactions on all instances to finish
enq: TX – contention Lock held by a transaction to allow other transactions to wait for it
enq: TX – row lock contention Lock held on a particular row by a transaction to prevent other transactions from modifying it
enq: TX – allocate ITL entry Allocating an ITL entry in order to begin a transaction
enq: TX – index contention Lock held on an index during a split to prevent other operations on it
enq: UL – contention Lock used by user applications
enq: US – contention Lock held to perform DDL on the undo segment
enq: WA – contention Lock used for recovery when setting Watermark for memory usage in AQ notifications
enq: WF – contention This enqueue is used to serialize the flushing of snapshots
enq: WL – contention Coordinates access to redo log files and archive logs
enq: WP – contention This enqueue handles concurrency between purging and baselines
enq: XH – contention Lock used for recovery when setting No Proxy Domains for AQ HTTP notifications
enq: XR – quiesce database Lock held during database quiesce
enq: XR – database force logging Lock held during database force logging mode
enq: XY – contention Lock used for internal testing