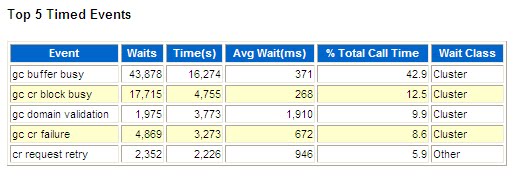
TOP 5 Timed Event -Cache Buffers Chains

Problem: High CPU and delay in the transaction processing.
Definition: The
The reasons for this latch can be
1)Sequence number generation code that updates a row in a table to generate the number, rather than using a sequence number generator
2)Index leaf chasing from very many processes scanning the same unselective index with very similar predicate
How to identify the Identify the segment the hot block belongs to -- Steps given below.. ( Metalink - How To Identify a Hot Block Within The Database Buffer Cache. [ID 163424.1]
Run the above query a few times to to establish the id(ADDR) that has the most
consistent amount of sleeps. Once the id(ADDR) with the highest sleep count is found
then this latch address can be used to get more details about the blocks
currently in the buffer cache protected by this latch.
The query below should be run just after determining the ADDR with
the highest sleep count.
Depending on the TCH column (The number of times the block is hit by a SQL
statement), you can identify a hotblock. The higher the value of the TCH column,
the more frequent the block is accessed by SQL statements.
In order to reduce contention for this object the following mechanisms can be put in place:
Problem: High CPU and delay in the transaction processing.
Definition: The
cache buffers chains latches are used to protect a buffer list in the buffer cache. These latches are used when searching for, adding, or removing a buffer from the buffer cache. Contention on this latch usually means that there is a block that is greatly contended for (known as a hot block).The reasons for this latch can be
1)Sequence number generation code that updates a row in a table to generate the number, rather than using a sequence number generator
2)Index leaf chasing from very many processes scanning the same unselective index with very similar predicate
How to identify the Identify the segment the hot block belongs to -- Steps given below.. ( Metalink - How To Identify a Hot Block Within The Database Buffer Cache. [ID 163424.1]
To solve a hot block, the application maybe need to be reviewed.
By examining the waits on this latch, information about the segment and the
specific block can be obtained using the following queries.
First determine which latch id(ADDR) are interesting by examining the number of
sleeps for this latch. The higher the sleep count, the more interesting the
latch id(ADDR) is:
SQL> select CHILD# "cCHILD" , ADDR "sADDR" , GETS "sGETS" , MISSES "sMISSES" , SLEEPS "sSLEEPS" from v$latch_children where name = 'cache buffers chains' order by 5, 1, 2, 3;Run the above query a few times to to establish the id(ADDR) that has the most
consistent amount of sleeps. Once the id(ADDR) with the highest sleep count is found
then this latch address can be used to get more details about the blocks
currently in the buffer cache protected by this latch.
The query below should be run just after determining the ADDR with
the highest sleep count.
SQL> column segment_name format a35 select /*+ RULE */ e.owner ||'.'|| e.segment_name segment_name, e.extent_id extent#, x.dbablk - e.block_id + 1 block#, x.tch, l.child# from sys.v$latch_children l, sys.x$bh x, sys.dba_extents e where x.hladdr = '&ADDR' and e.file_id = x.file# and x.hladdr = l.addr and x.dbablk between e.block_id and e.block_id + e.blocks -1 order by x.tch desc ;Example of the output :SEGMENT_NAME EXTENT# BLOCK# TCH CHILD#
-------------------------------- ------------ ------------ ------ ----------
SCOTT.EMP_PK 5 474 17 7,668
SCOTT.EMP 1 449 2 7,668
-------------------------------- ------------ ------------ ------ ----------
SCOTT.EMP_PK 5 474 17 7,668
SCOTT.EMP 1 449 2 7,668
Depending on the TCH column (The number of times the block is hit by a SQL
statement), you can identify a hotblock. The higher the value of the TCH column,
the more frequent the block is accessed by SQL statements.
In order to reduce contention for this object the following mechanisms can be put in place:
1) Examine the application to see if the execution of certain DML and SELECT statements
can be reorganized to eliminate contention on the object.
2) Decrease the buffer cache -although this may only help in a small amount of cases.
3) DBWR throughput may have a factor in this as well.
If using multiple DBWR's then increase the number of DBWR's.
4) Increase the PCTFREE for the table storage parameters via ALTER TABLE
or rebuild. This will result in less rows per block.
5) Consider implementing reverse key indexes
(if range scans aren't commonly used against the segment)
6) In the AWR you can look for segments with high buffer waits and sql statements whose elapsed times are high on a particular objects. If you are having high transaction OLTP databases it is always better if we can have the lesser block size to avoid the contention like 4k block size.
